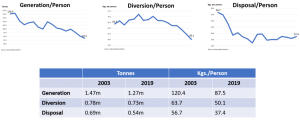
The good news is that Ontario householders are generating less paper, plastic, glass and metal waste these days, 14% less than they were back in 2003. That is the year the province regulated industry to share the net cost of the province’s popular Blue Box program and waste statistics became more widely available.
Of course, the number of people living in the province has increased since 2003, which normally means more waste is generated, but on an individual basis Ontarians have done well here too, reducing their generation of Blue Box waste by an impressive 27% over the period.
Generating less waste in the first place (the first of the three Rs, reduction) normally means sending less waste to garbage. Which, in this case, is also true. Ontario households dumped 22% less printed paper and packaging in 2019 than they did some 16 years ago. As individuals, Ontarians were even better, dumping 34% less than before.
This is all good news. The ‘bad’ news is that waste performance is usually measured by weight (as above): by kilograms per person, tonnes per household. Unfortunately, measurement by weight distorts the overall picture somewhat because it is not the weight of materials that fills up recycling trucks and landfills, it is how much space they take up (their volume). Landfills get fat, not heavy, as they say.
This caveat on measurement, weight instead of volume, helps explain the other piece of bad news: that Ontario’s Blue Box today is sending less material on for recycling than ever before. In 2003 the system was estimated to be recovering 53% of all Blue Box materials. In 2010 it peaked at 68%, but ever since then it has been on a progressive downward slide to its current 57% (the first time it has been lower than the province’s required 60% target since 2005).

Why? In addition to some straight out elimination of printed paper and packaging there has been a significant light-weighting of materials over the years (reducing the size and shape of newspapers, using lighter and thinner variations of paper, plastic, glass and metal, cutting out a layer here, a flap there).
But there has also been a major change in the type of material ending up in the home. Gone are many newspapers (replaced by digital alternatives). And when did you last see a telephone directory delivered to your doorstep? The generation of printed paper has plummeted 36% over the last 10 years alone. And these, of course, are heavier materials.
At the same time, there has been a major increase in the amount of lighter weight plastics in the home (up 20% per person since 2010). The biggest increase has been in the catch-all category of “other plastics” (things like yoghurt containers, hand cream tubes, margarine tubs and lids, blister packaging for toys and batteries, egg cartons, and laundry detergent pails). Most of these (65%) currently end up in the garbage.
So, there you have it. We are generating less waste but the waste we are generating today tends to be lighter and less recyclable. Which is why the overall Blue Box recycling rate is trending downwards. This has major implications for meeting the province’s proposed new waste diversion targets. Are they realistic? Or are they just a political green wish? Stay tuned.

